EXM comes Out Of the box with Sitecore 9+. That’s great, but how many emails can it send? How do you scale it to meet business requirements? These are questions that need to be answered well ahead of rolling out your new email marketing campaigns as there may be some architectural or infrastructure changes required.
Tag: Sitecore 9
EXM on Sitecore 9.0.x
Sitecore 9+ ships with EXM, a powerful Email Marketing tool that can put XDB data to work.
EXM scheduling of A/B Test in non-UTC timezone
A/B Testing in EXM is a great way to learn from and optimise email campaigns to improve engagement results. However I came across an an edge case that had some unintended consequences (at least in Sitecore 9.0 Update 1, perhaps in later releases?).
List Manager and EXM contact search not returning contacts
While testing EXM on a Sitecore 9.0.1 instance we noticed some strange happenings when attempting to view previews for a specific recipient. While the lists were being populated ok, it was not searchable by email. This was also the case in List Manager.
Read More »
Sitecore 9 slow login – clean up your tickets
We noticed that the login on our CM was degrading, but with no real changes that we thought may affect this. At it’s worst it was taking up to 45 seconds to login successfully. I did a quick profile to see what was going on. Lo and behold a lot of time was being spent hitting the core db looking for existing login tickets, which allows for the remember me functionality to work.
Upon investigating there were LOTS of tickets in the properties table of the core db. A quick google led me to some older but helpful posts including: https://blog.coates.dk/2016/05/11/sitecore-client-and-logon-is-very-slow-properties-table-again/
As mentioned in this post, there is an agent that is supposed to clean up the tickets once expired, but clearly something was going amiss. I was able to confirm the CleanupAuthenticationTicketsAgent was running, however it was never picking up any tickets for cleanup.
ManagedPoolThread #2 12:04:16 INFO  Job started: Sitecore.Tasks.CleanupAuthenticationTicketsAgent
ManagedPoolThread #2 12:04:16 INFO  CleanupAuthenticationTicketsAgent: Number of expired authentication tickets that have been removed: 0
ManagedPoolThread #2 12:04:16 INFO  CleanupAuthenticationTicketsAgent: Total number of authentication tickets to process: 0
ManagedPoolThread #2 12:04:16 INFO  Job ended: Sitecore.Tasks.CleanupAuthenticationTicketsAgent (units processed: )
There were definitely tickets that should have expired, so I hit up Sitecore support for some insight. As it turns out, this is a known bug in 9.0.1 and 9.0.2 as outlined at https://github.com/SitecoreSupport/Sitecore.Support.223702 . Before installing the patch though, we manually cleared out really old tokens in SQL.
-- EG. This will delete all tickets generated in Dec 2018.
-- Adjust the date string to suit your needs. Be careful :D

USE {core_database_name};
DELETE
    FROM [dbo].[Properties]
    WHERE [dbo].[Properties].[Key] like '%SC_TICKET%'
    AND [dbo].[Properties].[Value] like '%^201812%';
This had an immediate positive impact to login performance, jumping down to a second or two.
The patch has since been installed and tickets are getting cleaned up happily as reported in the logs. Happy days. As always check with support first before installing any patches that may not be appropriate for your specific environment.
EXM previews not sending
Problem
When doing a “send quick test” from the EXM review tab, we were seeing everything working as expected for the first few sends. However on subsequent sends (usually the 4th – 5th) the email was not sent and the spinner next to the send button took a long time. The XHR request to /sitecore/api/ssc/EXM/ExecuteSendQuickTest eventually timed out and showed the error “We are very sorry, but there has been a problem, please contact your system administrator.”. I thought about doing that….but that would probably cause some sideways looks given I’d be talking to myself.

This only appeared to be an issue in a Paas environment (we were unable to reproduce locally) on Sitecore 9.0.1 (with the EXM cumulative hotfix). This did not appear to be an issue with any dispatch tasks (just the “send quick test”).
Investigation
Investigating the CM logs revealed that the latter sends that were failing had the following entry, followed by not much at all:
ManagedPoolThread #6 07:36:59 INFO MessageTaskRunner is starting 0 e-mail dispatch worker threads.
Previous successful sends would see something more like :
INFO MessageTaskRunner is starting 10 e-mail dispatch worker threads.
Then a series of entries like the following indicating the thread spinning up, then exiting once no more work is required:
INFO E-mail dispatch worker thread ‘MessageTaskRunner worker thread 3’ is starting.
………
INFO E-mail dispatch worker thread ‘MessageTaskRunner worker thread 3’ did not find any active tasks and exits.
Solution
As this appeared to be a threading issue we experimented with various settings such as Numthreads & MaxGenerationThreads, but see similar issues for each. Just with varying number of threads spinning up/exiting on the successful attempts.
After discussing with support, they were able to identify a bug and provide a patch (ref 214025). This issue applies to Sitecore 9.01 and 9.02.
This patch replaces the implementation of the SendEmail processor in the SendEmail pipeline, which ensures that the thread semaphore is fully released for test sends. Without the patch EXM would only be able to send up to the amount of test messages equal to the MaxGenerationThreads setting as the threads are not properly released on previous attempts.
Active tests not showing
A/B Testing is great
Sitecore’s Experience Optimization content testing functionality is a powerful tool in the Sitecore XP arsenal. When coupled with a solid engagement value strategy, marketers can get deep insights into what actually works (rather than what we think may work).
….when it works
Recently we hit an issue in a recently upgraded (8.2 -> 9.0.1) installation that would not display newly created tests correctly. The process of creating the test all went smoothly, the test would actually be running…but it would not display in the “Active Tests” tab of Experience Optimization. Drafts and Historical tests all displayed as expected.
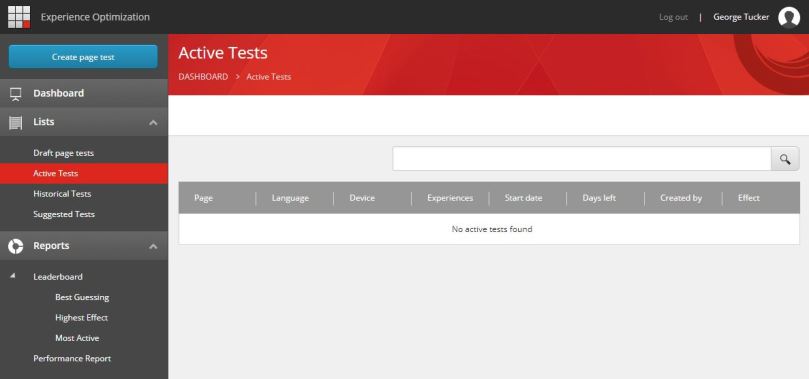
Testing through our environments identified that things were working locally, but any upstream deployments all reproduced the issue.
All tests get indexed by your search provider upon creation. As part of the upgrade we’d also switched search providers to Azure Search (locally we use SOLR) so thought I’d investigate the [sitecore-testing-index]. All looked ok ¯\_(ツ)_/¯ . Documents were being added for each test we created with what seemed appropriate data. There was also a fairly cryptic INFO message in the logs when attempting to load the Active tests:
9300 02:31:53 INFO AzureSearch Query [sitecore_testing_index]: &search=This_Is_Equal_ConstNode_Return_Nothing
After hitting up colleagues and Sitecore community slack we were still at a loss, so raised a Sitecore support ticket. After an open dialogue and many configs later, we had a solution!
The solution
This was a config issue with Azure search. One of the Sitecore fields to be added to the [sitecore-testing-index] is a flag to whether the test is running (“__is running“). The default configs fail to add this field to the index correctly. Easily fixed…..it’s a one line change (isn’t it always?).
The Content Testing configs for 9.0.1 (and 9.0.2) provided in the Sitecore package downloads (for Azure AppService) you’ll see the following:
<field fieldName="__is_running" cloudFieldName="is_running____" boost="1f" type="System.Boolean" settingType="Sitecore.ContentSearch.Azure.CloudSearchFieldConfiguration, Sitecore.ContentSearch.Azure" />
This code needs to change to the following (I recommend patching it to avoid any future deployment/upgrade issues):
<field fieldName="__is running" cloudFieldName="is_running_____b" boost="1f" type="System.Boolean" settingType="Sitecore.ContentSearch.Azure.CloudSearchFieldConfiguration, Sitecore.ContentSearch.Azure" />
The changes are subtle, but important! Firstly, it’s referencing the field name correctly (with a space). Secondly it is giving the index field name a _b suffix to further indicate it is a boolean.
After making this change and then rebuilding the [sitecore-testing-index] in the control panel, marketers and analytics teams rejoiced as they were able to view all of their glorious active tests.
Marketing Automation stored procedures and tables missing
Seen this message in the exception logs of your shiny new Azure app service instance of Sitecore 9?
Could not find stored procedure ‘xdb_ma_pool.AutomationPool_Stall’
ARRRRRGH. Missing Stored Procedures?!?! Who’s been dropping stuff in my DB! It’s newly deployed…how can this be! It worked on my dev machine! Never fear, there’s an explanation and easy fix.
No…you haven’t been dropping DB objects in your sleep. This just appears to be an oversight in the Marketing Automation SQL dacpac in the Sitecore 9 Azure App Service web deploy packages. In fact there are a few other objects missing too:
Stored Procedures
AutomationPool_Stall
ContactWorkerAffinity_ReleaseLease
ContactWorkerAffinity_TakeLease
Table
StalledAutomationPool
This has been confirmed by Sitecore support and they’ve published a KB https://kb.sitecore.net/articles/065636 . Also the KB now contains a SQL script to create the missing objects. Running this script on the Marketing Automation DB in your Azure environment should create the missing objects and resolve the issue. This is confirmed as an issue on 9.0.1 and 9.0.2.
We’ll be adding this as a post-install script to all our ARM template deployments to avoid any manual steps in future deployments.
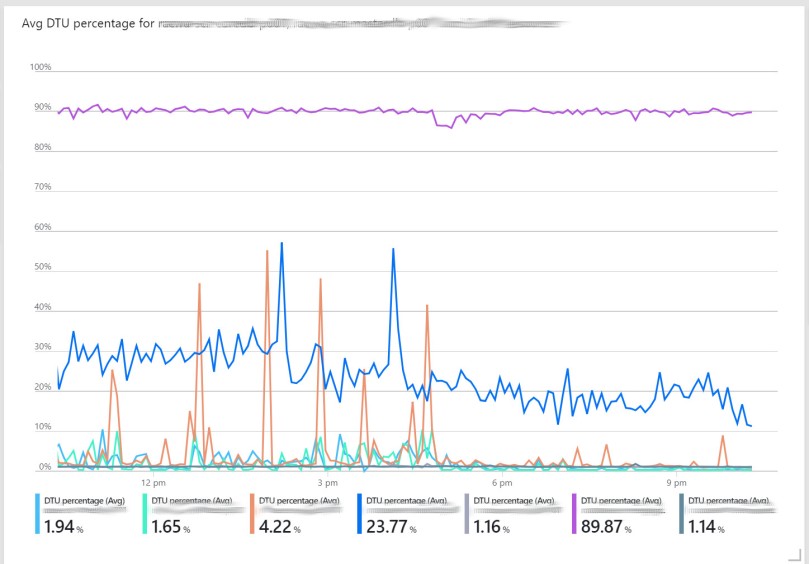
Sitecore dashboards in Azure portal
Sitecore 9 in Azure PaaS offers a robust ecosystem that will allow you to monitor performance of your application and infrastructure. Metrics are made available via the built in metrics of the PaaS environment and metrics logged to Application Insights. Sitecore also captures custom metrics relevant to Sitecore operations and pushes them to App Insights. By default there is a lot of data being captured, so much so in fact it’s worth trimming any metrics that you don’t require. Check out the Sitecore’s post deployment recommendations for App Insights.
Application insights is amazingly powerful, allowing you to build queries (in the Kusto query language), but with power comes great responsibility. Querying to trawl logs is one thing, but at a glance I want to see the health of my Sitecore instance. The Azure portal offers a customisable dashboard system so that you can be greeted with graphs, metrics & labels and then quickly change between other dashboards (possibly for other projects or environments). Graphs and charts can easily be customised in the metrics blade then quickly added to your dashboard by selecting “Pin to dashboard”. Dashboards can also be shared with other users in your Azure subscription. Microsoft have provided some solid documentation on creating/customising and sharing dashboards.
Usually I’ll try to get as much relevant data as possible into 2 sections. One for public facing (eg. CD metrics, uptime, response times etc) and one for Sitecore “behind the scenes” (CM/Processing and reporting metrics). There are some key metrics I like to keep an eye on. These are usually indicators that something might be wrong and it’s time to investigate the cause by drilling down or hitting the logs.
SQL
- DTU Percentage
App Services & App Service plans
- CPU Percentage
- Memory Percentage
- Requests
- Avg response time

App Insights
- Exceptions (sum, split by role)
- Sitecore.Caching / Cache Misses /s
- Failed requests (exposes all HTTP responses > 400)
- Availability statistics
- Live Stream (just a overview and link)

Adding all of these pretty much fill a decent sized dashboard, but there are some other metrics that are good indicators of health too. So it may be worth baselineing them and adding (email or webhook) alerts above your thresholds as they may not be front and centre (you can do this for almost all metrics!).
- Sitecore.Analytics/ Aggregation Live Interactions Processed /s
- Sitecore.Analytics/ Aggregation Contacts Processed /s
- Search latency
- Search queries /s
The list of available metrics Sitecore logs by default can be found in App_Config/Include/zzz/
From here you can continue to add and tweak your dashboards that best suit your solution.
xDB index rebuild with Azure Search
As part of a Sitecore migration (8.2 to 9.0.1) we had a requirement to migrate a sizeable xDB implementation. The xDB data migration tool makes this super easy. It reads straight out of your existing mongoDB and pushes it to xConnect. As new contacts and interactions are pushed to the 9.0.1 xDB (in our case in Azure SQLDB) the indexer service will pick up the changes and update the appropriate index. Sweet!
So what happens if you want to change your search provider from Solr to Azure Search? It stands to reason that you should just be able to hook up Azure Search in xConnect in a similar way to the core role indexes (check out Azure Search on Sitecore 9) with the appropriate Configs and connection strings, then rebuild the search index. One problem, there are some serious caveats on the xDB index rebuild for Azure search. They are alluded to in the Rebuild the xDB Search index documentation (Update May 2018: The doco has been updated and is much clearer now!), but may need some further clarification. Important points:
- A full xDB index rebuild is not supported on Azure Search as of 9.0.1. That means that if you want to rebuild the xDB search with historical data, it’s not supported out of the box. Please note though that the indexer will rebuild the index for everything that is still available in the change tracking log in the SQL db (by default this is a 5 day retention). But anything before that will not be included.
- This may not be a deal-breaker for a migration as your data will be indexed as the xDB migration tool pulls everything across. Just plan your migration accordingly with the limitations in mind.
- This will affect anyone looking to switch from Solr to Azure search on 9.0.1
- There is probably some potential to code this yourself!
- Sitecore support have it as a feature planned for 9.0.2, so may be best to hold tight for now and get support ootb.
- I’m hoping the doco gets updated to be a bit more clear as a few in the community have been thrown by this. (Update May 2018: it has been!)
